JProfiler helps you find performance bottlenecks, pin down memory leaks and resolve threading issues in your Java application. JProfiler combines CPU, Memory and Thread profiling in one application and is developed by ej-technologies. The latest version at the time of this article is 6.0.
Posts Tagged ‘performance’
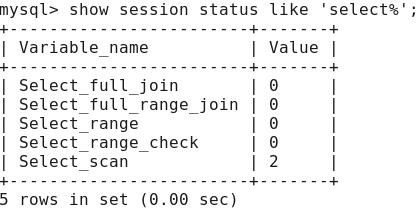
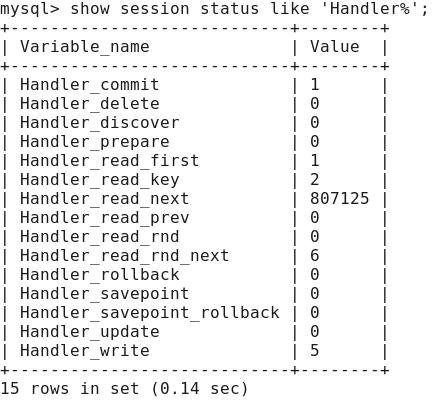
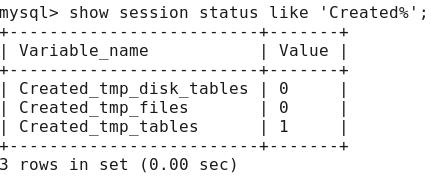
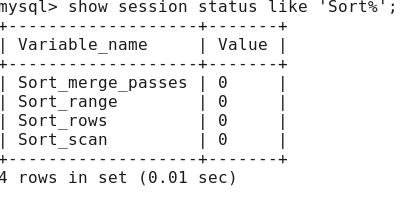
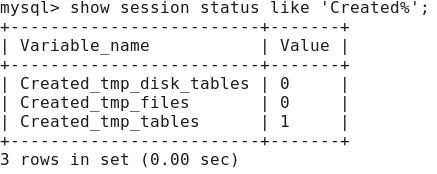
The combination of FLUSH STATUS and SHOW SESSSION STATUS can be used to see what happens while MySQL executes a query. First, run FLUSH STATUS to reset session status variables to zero.
mysql> FLUSH STATUS;
mysql> SELECT COUNT(*) FROM TABLE;